

BLOG
How SMBs Can Use Google Analytics Reports to Increase Revenue
Having a great website and an effective digital marketing campaign is essential for any small to medium-sized business (SMB) looking to increase their online visibility and boost revenue. But how does the business measure their online visibility and decide which direction to take? This is where a basic knowledge of Google Analytics (GA) reporting is vital to SMB owners and employees and their key business decision-making.
What is Google Analytics?
Google Analytics is a very clever tool designed by our friends at Google. It helps us (and you) to analyse all sorts of data regarding the performance of websites and digital marketing campaigns.
More importantly it facilitates optimisation of a website’s SEO performance, organic search visibility, shows you how you can attract more visitors to your landing pages and how you can better segment and target specific groups of users… all with the objective of improving return on investment (ROI) and boosting revenue.
Most people involved with an SMB are aware of GA, but many don’t know which reports to concentrate on, what to make of all the resulting data, or which reactive actions to take based on the data.
That said, let us touch on six reports that will give you a good understanding of the basics of Google Analytics. We’ll cover what data the report contains, why it’s important, and a common reactive action we/you might take to optimise online presence.
1. Traffic acquisition/sources report
What data does this report contain?
This report tells you where the traffic visiting your website has come from. Was it an organic Google search result, an AdWords ad, a social media post or ad, a display ad or an email campaign?
Why it’s important to your SMB?
Understanding where your traffic is coming from is essential because it will help you pinpoint which avenues are working well (and can be employed more heavily) and which ones are performing poorly and need some fettling. It helps SMBs understand where best to spend their advertising dollar.
What action you might take based on the data?
Look at the data over a long date range, i.e: one year or longer. Identify which way individual traffic sources are trending over that time. Consider whether seasonality may be having an impact here, or whether some of your digital marketing activities are less effective now than they were at the same time last year.
2. Content report
What data does this report contain?
Having quality content on your website is invaluable to your company’s user engagement. The Content Overview report helps you judge how effective your website’s content is in attracting your target audience/customers and answering their search queries.
Why it’s important to your SMB?
The tell-tale sign of poor content on your website is a lack of engagement with the user. This ultimately leads to less conversions and less revenue. The metrics to judge content and engagement by are time spent on page, how many pages are viewed per visit (pages per session), and bounce rate. If users are visiting multiple pages on your website, viewing each page for as long as it takes to read it (and not leaving immediately), all indicators suggest the content is relevant and of value to the user. If you have a high bounce rate (users leaving your site quickly), your content may be poor or misaligned with how Google’s algorithm describes your website. Learn more about successful content marketing here.
What action you might take based on the data?
Look at your ten pages with the best pageview numbers and identify pages that have poor engagement metrics relative to the other highly visited pages. Perhaps one of your product pages has a high bounce rate — could it be the product image on that page is low quality, or the product description is poor? If it’s an informational page, does the content make good use of subheadings and easily scannable bulleted lists to encourage reading?
Note that if your blog is responsible for attracting a large proportion of page views it’s important to understand that blog traffic performs very differently to core site content. We often see blog posts with high bounce rates (excess of 80%). Therefore, it’s important not to look at content engagement metrics in aggregate, as metrics can easily be skewed by one or two outliers.
3. Conversions report
What data does this report contain?
The conversions section of GA is where you can track your conversion rate. Namely how many users visit your website and go on to buy your products or services (a conversion) – the ultimate measure of your SMB’s online success.
Why it’s important to your SMB?
This is where the bread and butter are because all the website traffic in the world won’t put food on the table if it doesn’t lead to conversions. The GA conversion section lets you set up different destination goals to track successful conversions. If you’re in e-commerce you might set up your order confirmation page as the destination goal to help you track how many times it was reached and in turn how many times your leads converted. Read this for more about conversions and attribution modelling.
The different types of goals GA will let you track include: destination (success page) goals, page visit goals, visit duration goals and event triggered goals such as clicks on email address or taps on phone numbers.
What action you might take based on the data?
Compare the performance of each traffic channel in terms of their conversion rate. Do any traffic sources stand out as having considerably higher (or lower) conversion rates than other channels? If so, do they drive a high volume of conversions, or is their conversion rate based on a small volume of traffic and conversions?
From this you can reflect on how much you are spending to attract traffic via each channel and then determine which channels are doing the best job of generating conversion actions on your site. Invest more in those driving conversions and optimise those that are lagging. Be mindful that different traffic sources also have different strengths: for example, Social Media can be a great channel for building brand awareness and loyalty, but it may not always be a strong converter of visitors.
4. Assisted Conversions AdWords report (inside Google Analytics)
What data does this report contain?
If your SMB has a Google AdWords campaign running, you can use this report to track how many clicks your ads have received.
Why it’s important to your SMB?
Known as ‘Paid Search’ in the GA console, it’s important to use this report in addition to the reports within the AdWords console because it gives better insight into the user’s actions on your website, after they’ve clicked on your AdWords listing.
The data in the Paid Search report can be used to help test different variations of ad copy to establish which version results in better click-through rates, and the performance of specific search queries and keywords you may be targeting in your campaign.
AdWords performance reporting is especially important to help with visibility on the mobile platform, where over 60% of searches now take place and having your ad in the top two SERP (search engine results page) results can be make or break with the limited screen space.
What action you might take based on the data?
Use GA to understand your AdWords data at a deeper level than is easily available inside the Google AdWords interface. Use the ‘Assisted Conversions’ report in the ‘Conversions’ section of Google Analytics to focus on AdWords keywords that played a part in a conversion but weren’t necessarily the final keyword which generated the conversion, and as such didn’t receive the credit. Read more about attribution models and giving credit where credit’s due.
5. Site speed report
What data does this report contain?
Data regarding how long each individual page on your website is taking to load.
Why it’s important to your SMB?
The common goal of more conversions will never be realised if users leave a website because it’s taking too long to load. As you increase your site speed, you should see a decrease in bounce rates. Not only this, but Google use site speed as an SEO ranking factor – if your website has pages that are slow to load, the Google algorithm will be more likely to overlook your website and omit it from SERPs. Read more about mobile site speed here and here.
What action you might take based on the data?
When looking at site speed one of the most important reports to monitor is the ‘Avg Document Interactive Time (sec)’ report as seen below. In short, the ‘Avg Document Interactive Time (sec)’ is the time it takes for the page to become interactive, i.e: the user can scroll and click on it, even though it may not be fully loaded yet. Once a user can interact with a page, they are less likely to leave it. Unfortunately, this report is buried deep in GA, but it’s well worth digging to find it (see the yellow highlights below to help you).
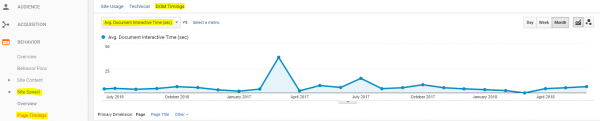
If you identify spikes or a worryingly rising trend, get in touch with your developer and ask them to investigate further.
6. Audience overview report
What data does this report contain?
This report offers valuable insights into your customer base, their location and their buying habits.
Why it’s important to your SMB?
Once heavily skewed by GA spam which rendered the data all but useless, the Audience Overview report is now a helpful tool for learning about your users, with the effect of spam now negligible. The report is especially applicable for your paid search marketing because it will help you be more targeted with your efforts. If you identify a trend that sees a lot of your users converting at a specific time of day from the same part of the country, you can target this audience more aggressively by focusing your AdWords campaign more heavily on this time and geolocation.
If your SMB provides localised services, the Audience Overview can help you minimise unnecessary spend (via PPC) on users outside of your catchment area who can’t utilise your services and are less likely to convert when they arrive on your site and realise you’re not in their area.
What action you might take based on the data?
The ‘Audience’ section of GA can be great for identifying user segments that are more (or less) likely to convert. This data allows you to focus more intently on marketing to one of these user segments. It can also help you improve an aspect of your marketing to a specific set of users to make them more likely to convert. For example, you might find your mobile user segment aren’t completing the ‘click to call’ conversion goal you have set up in GA. Consider why this might be — perhaps your contact number isn’t clearly visible to mobile users on all pages of your website. If that’s the case, talk to your designer about adding a ‘Call’ button to the header area of the mobile version of your site.
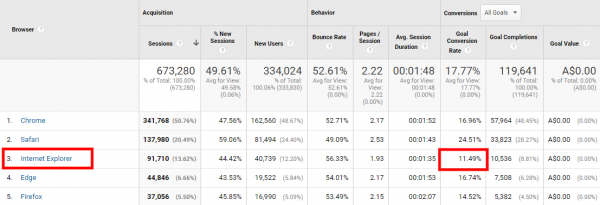
Another great use for this section is to view engagement and conversion rates by browser type and model. It’s not unusual to see that users of some browsers convert at a much lower rate than users of another browser. This might indicate that your site isn’t working as well as it should on the poorly converting browser: another one for your designer/developer to investigate for you…
Why are these Google Analytics reports especially important to SMBs?
The reports we’ve outlined above are the basics we recommend any SMB to focus on to better understand and optimise their website’s performance and improve their digital marketing efforts.
The data highlighted in these reports will help inform your key business decisions and help you grow your online visibility and overall revenue. While big corporates have a team of marketing boffins reporting these figures to the decision makers, at an SMB the decision-making will likely be shared between more employees who wear multiple hats and are therefore required to have a better understanding of their website’s performance.
For more information about setting up a Google Analytics account, which Google Analytics reports to dissect and what actions to take based on the data, drop us a line.

Related posts


- March 2024: Google algorithm update - A crackdown on low-quality AI generated content
- GA4 - Where to Start?
- Compulsory shift to Responsive Search Ads coming in June
- What are Google Ads keyword match types and how are they changing?
- How do I get my business to show up on Google? Part 3: Google Shopping Ads