

BLOG
GA4 - Where to Start?
The time has come, we’ve reached that point. Universal Analytics with all its familiar features is now a thing of the past. We’ve entered the age of GA4. Although unfamiliar for many, this platform offers advanced ways to measure and analyse your website traffic. With any new interface the challenge is knowing where to start. Intuitively, GA4 presents their reports as a life cycle, starting with acquisition. Let’s dive in and focus our attention here and touch on the main need-to-know areas of this report.
We assume you already have a GA4 account, and it’s linked to your website. If you’re not there yet you can learn how to do that here.
Please note, the following is intended for users on a PC. Although it’s a similar journey on the mobile app there are some differences.
How to find the Acquisition report
When you login to your GA4 account you’re presented with the home screen. You’ll see on the left side a menu of icons. Hover over these icons with your mouse and it’ll expand with the titles of each icon. Hit on “Reports”. This will open up a submenu. In this submenu you’ll see a section called “Life cycle”. Here you’ll click on “Acquisition”, which will expand yet another submenu. Head into “Traffic acquisition”. Okay, let’s take a closer look at this report.
Note: by default, the timeframe is set to the last 28 days. You can change this by clicking on the date selector at the top right side of the screen.
Before moving ahead let’s first cover what acquisition means in the context of website traffic. Put simply, it’s the data that reveals how many people are arriving at your website, where they are coming from and how engaged those users are. In short, it offers a gauge of the quantity and quality of your website traffic over time.
The line graph 📈
This is the first thing you’ll see. We’re all familiar with line graphs and they’re great for providing a quick insight into the overall trend of a data set. Below is a screenshot example of this line graph showing the number of website sessions over time for five traffic channels. For this example, these channels are Paid Search, Organic Search, Direct, Organic Social, and Referral.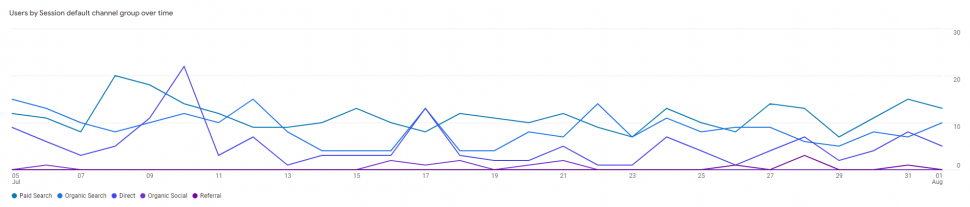
The bar graph 📊
This graph provides a visual representation of what portions each channel is delivering for website sessions. Below you’ll see an example, in this case Paid Search is the channel providing most of the website sessions.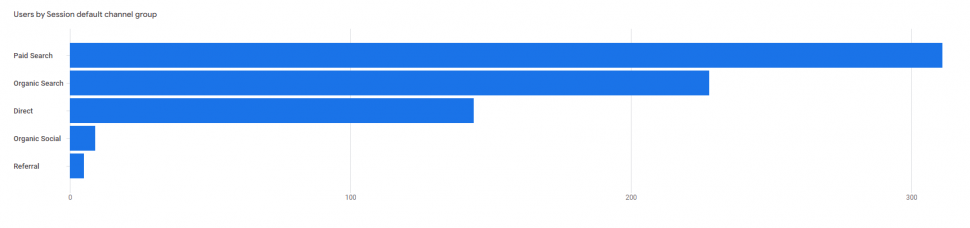
The Table 🔍
This is where we get down to the nitty gritty results. The default table shows data for your website sessions. The left column lists the channel groups, these are generally the same groups presented in the graphs. Along each row of the channel groups are a series of columns with key metrics. Let’s take a closer look at each metric.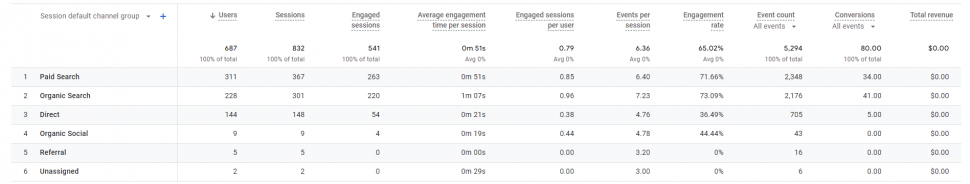
Users
A user is a person visiting your website. They might visit your website on multiple devices resulting in multiple sessions being counted for that user. If your objective is to get more people visiting your site, then you’ll need to keep a close eye on this metric.
Sessions
A session is counted each time a user visits your website. You’ll generally want your website users to frequently visit your site. You can see how this activity is tracking by viewing these session numbers.
Engaged sessions
This is defined as the number of sessions that lasted longer than 10 seconds, or had a conversion event, or had 2 or more screen or page views. The greater the proportion of engaged sessions per session the better. If your site offers a good experience and the right information that the user is looking for you should see good results here. This metric effectively replaces the “bounce rate”, a popular performance metric in Universal Analytics.
Average engagement time per session
This is an average of how long users spent on your site. If you’re working on publishing quality information to your site, you’ll want to monitor this metric. If the results are improving over time, you know you’re on the right track.
Engaged sessions per user
This is the ratio of engaged sessions to the total users on your site. You’ll be wanting to aim for this metric to improve over time.
Events per session
This is the average number of events that occurred on your site per session. Events are measurable interactions on your site. Such as a newsletter download.
Engagement rate
This is the percentage of users that were defined as engaged (see “Engaged sessions”) while on your site.
Event count
This is a total of all the measurable interactions on your site.
Conversions
A valuable event that is marked as a conversion will appear here. This column shows the total number of conversion events for each traffic channel. Aside from purchase revenue data this is one of the key metrics to monitor.
Total revenue
If you have an ecommerce website the purchase revenue data will appear here.
As you can see there’s allot of useful information in this report. Overall, it provides a picture of how your website is tracking and provides a useful reference as you work towards driving quality traffic to your site. We recommend viewing this report at least once a month to ensure you’re on the right path with your marketing efforts. Over time you’ll see what works well (and not so well).

Related posts


- March 2024: Google algorithm update - A crackdown on low-quality AI generated content
- GA4 - Where to Start?
- Compulsory shift to Responsive Search Ads coming in June
- What are Google Ads keyword match types and how are they changing?
- How do I get my business to show up on Google? Part 3: Google Shopping Ads